Architecture management
 Team-Friendly Structure that’s always in sync
Bring your processes, apps, agents, data, and tech into a single workspace that’s powerful enough for architects yet intuitive for the non-technical teams driving transformation. BlueDolphin removes duplication, keeps every discipline aligned, and makes enterprise architecture something everyone can actually use.
Discipline
Without Disorder
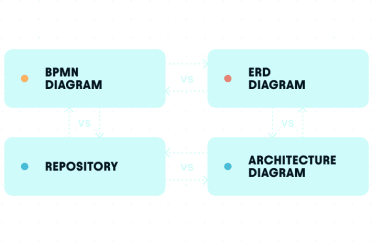
Give every discipline its own focused workspace while managing processes, apps, data, and tech in one connected repository that keeps everyone aligned and accountable.
Consistency Without Chaos
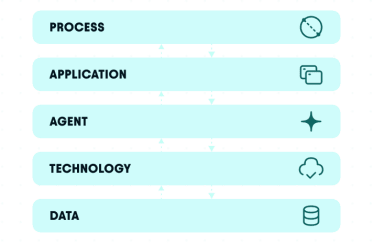
Link your processes, applications, agents, data, and technology so your repository stays consistent, current, and reusable without creating conflicting versions of reality.
Insight
Without Effort
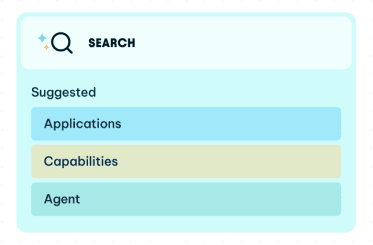
Bring AI into your repository and turn it into a knowledge engine anyone can query in plain language for better decisions, sharper planning, and automatically generated solution designs.

Faster decision-making and impact analysis through all business units.
"BlueDolphin guides us through the complexities of innovation, aligning strategy with execution, and empowering data-driven decision-making at every turn, connecting all business units in one repository."

Architecture that works upstream, downstream, & everywhere between

EA Built for doers,
not just documenters
Model your landscape, connect the dots, spot risks, and keep everything
in sync, all in a workspace designed for real-world delivery.

Application Portfolio
Management (APM)
Manage your entire application landscape in one connected, always-current view.
Application
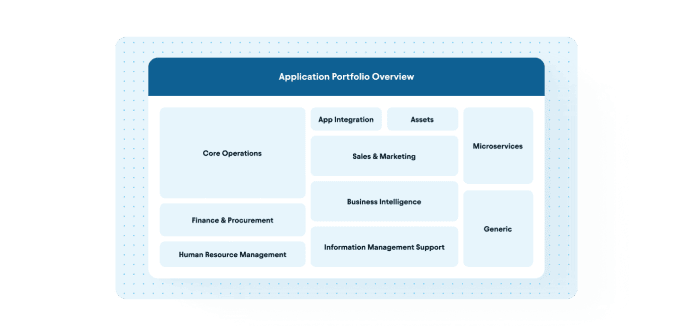
Landscape Overviews
Automatically generate an always-up-to-date
visualization of your application landscape with both
your current and future state applications.
Instant Insights
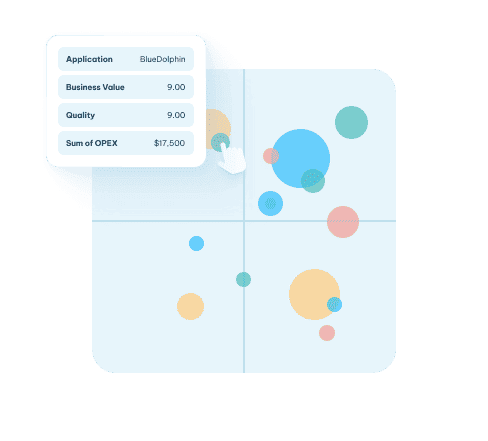
Quickly get insights with out of the box reports for TIME analysis, function overlap, cost assessment and lifecycle management.
Conditional Layouts
Use multi-layer conditional layouts to surface risks, lifecycle issues, ownership gaps, KPIs, and custom properties and view your landscape from multiple angles instantly.
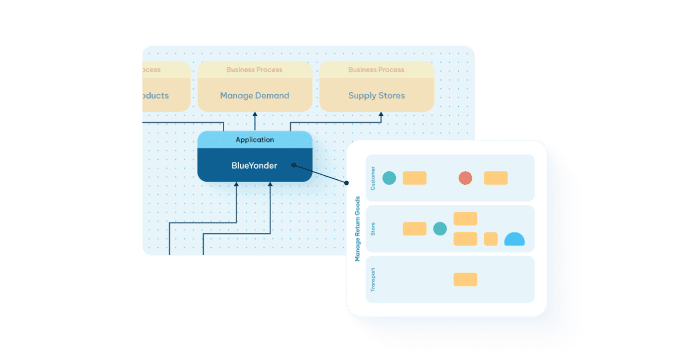
Multi-Layer Visualizations
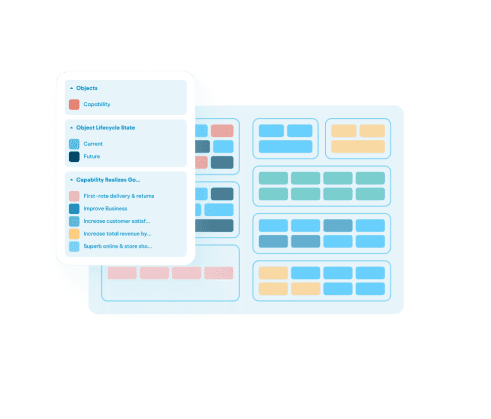
Zoom from a high level map into detailed views of
integrations, dependencies, data use, and
infrastructure without losing clarity.
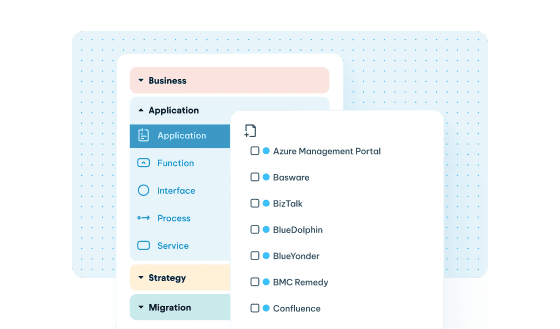
Configurable Meta-Model
Extend your application portfolio with any property your
organization needs. Use the fully configurable meta-model to
customize attributes, enforce governance, and create tailored
reports for your use cases.
Business Process
Management
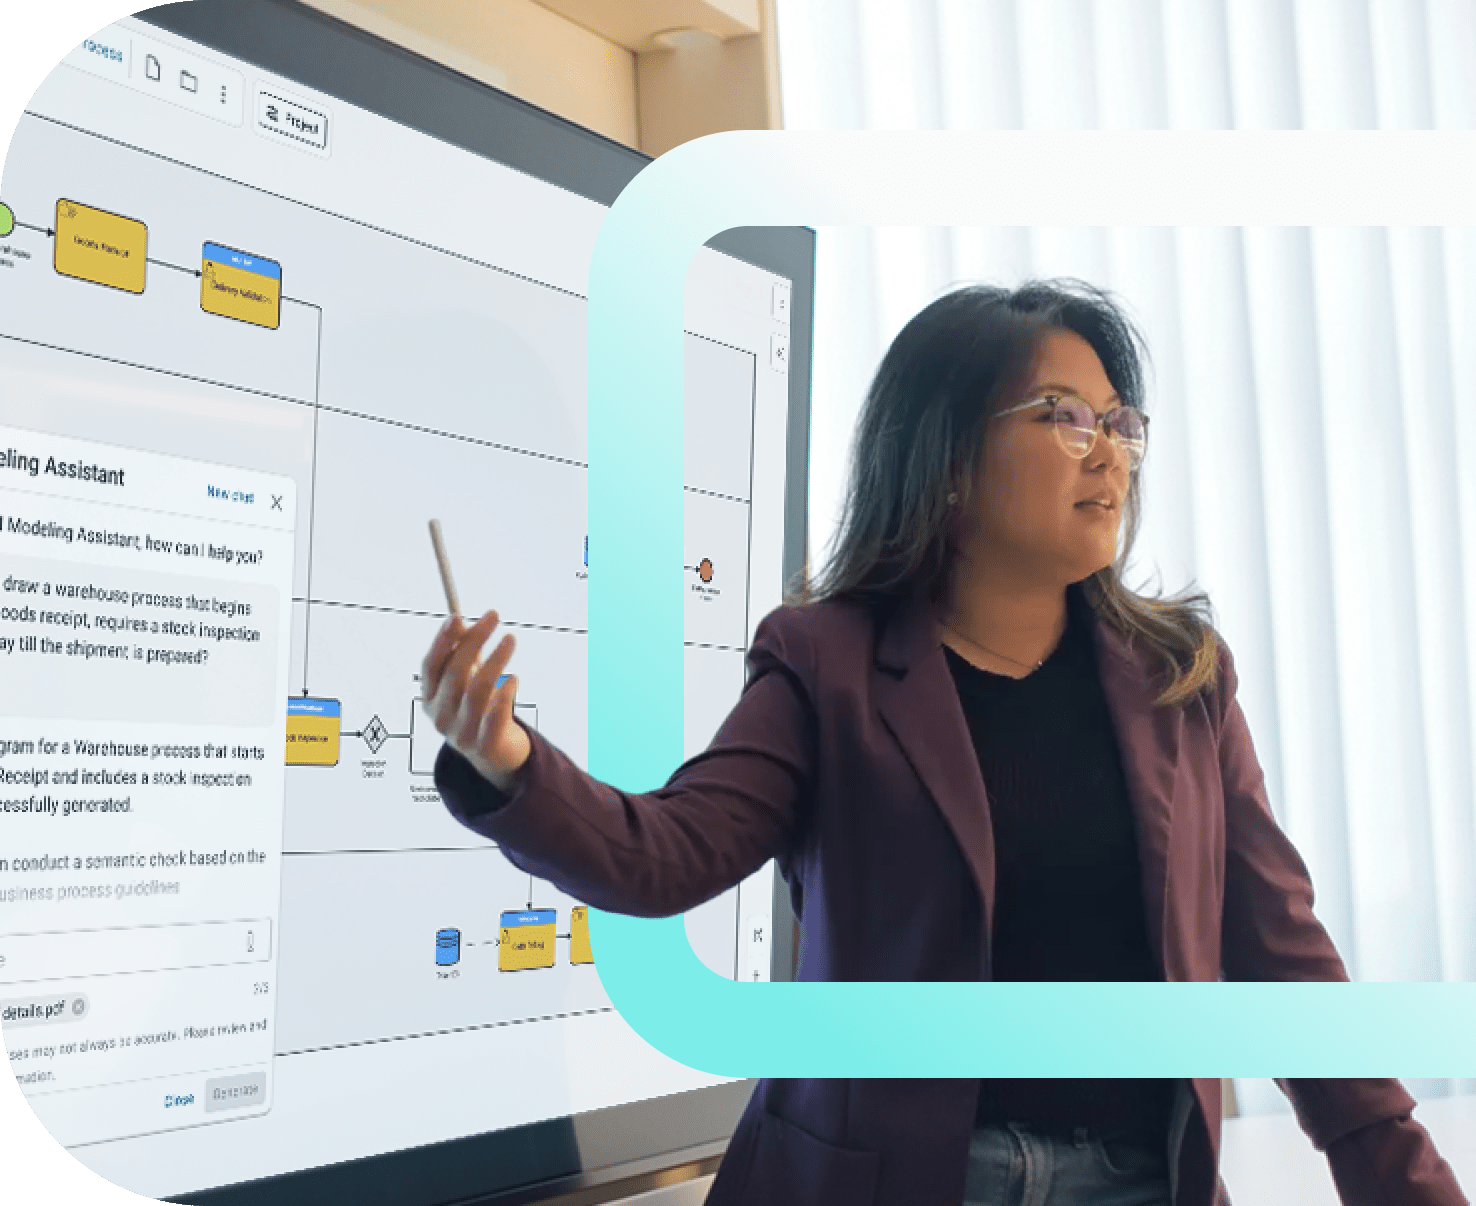
Model, generate, govern, and analyze all your business processes from a single workspace.
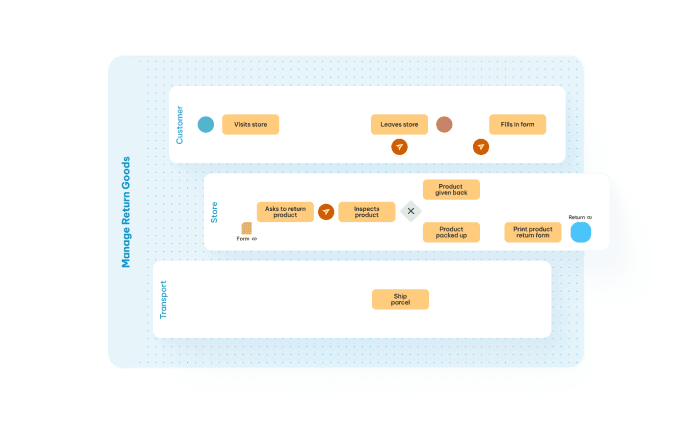
BPMN-Compliant Process
Diagramming
Create process diagrams that fully adhere to the global BPMN standard. Ensure clarity, interoperability, and consistency across teams and systems.
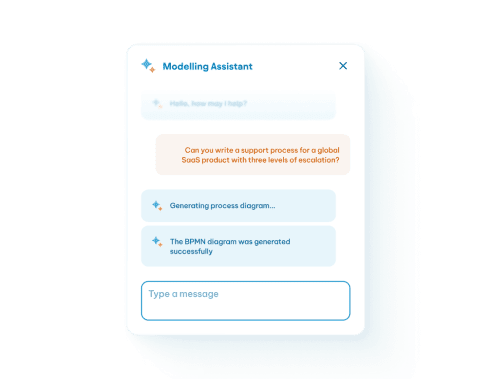
Generate BPMN
Diagrams with AI
Use AI to produce complete BPMN diagrams that follow the global standard by adding organizational context and turning text, transcripts, photos, or sketches into finished processes in seconds.
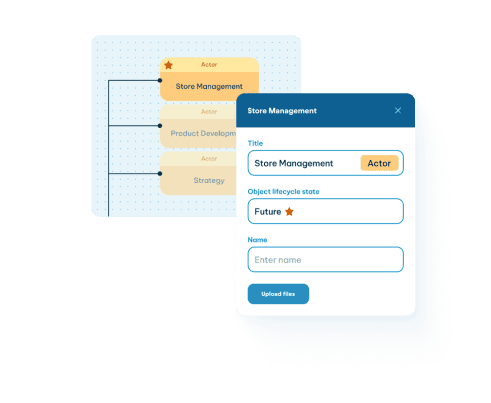
Process Lifecycle
Management
Move from rough sketch to structured diagram to published asset with a flexible workflow built for both ideation and enterprise-grade governance.
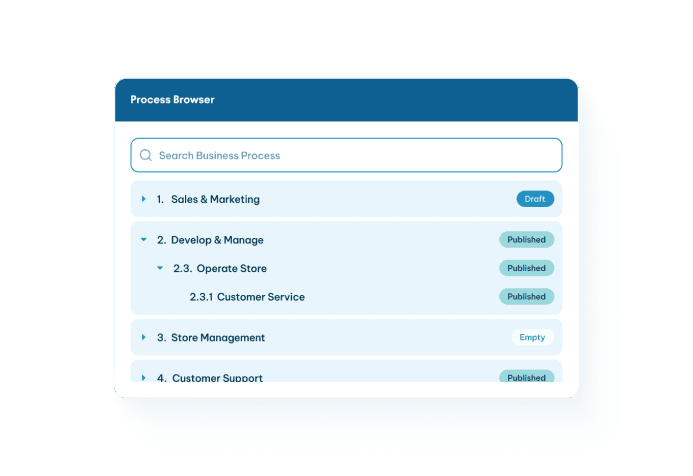
Process Portal
Publish your processes in a dedicated portal where teams can browse,
filter, and analyze using lenses, viewpoints, and custom metadata.
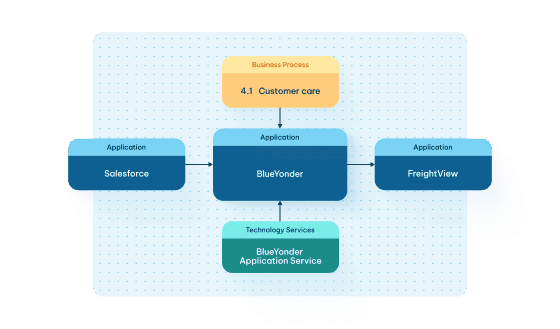
Link Architecture
to Processes
Link your processes to the applications, data objects, and
systems they rely on to keep your process management and
architecture aligned without conflicting realities.

Data Management
Make your data architecture tangible, structured, and actionable by connecting
your data landscape to your processes and applications for universal consistency.
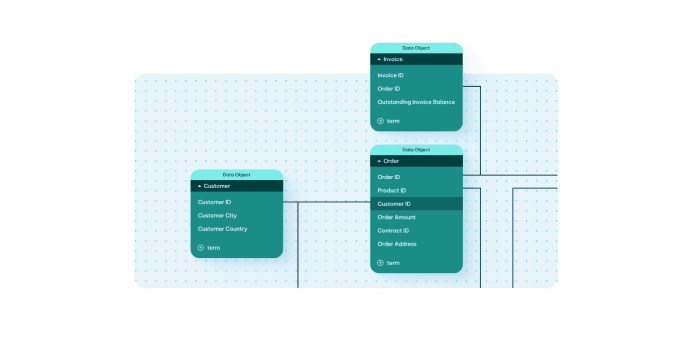
ERD Notation
Model entities, relationships, and attributes with standard
ERD notation and build clear, accurate data models that
reflect how your organization works.
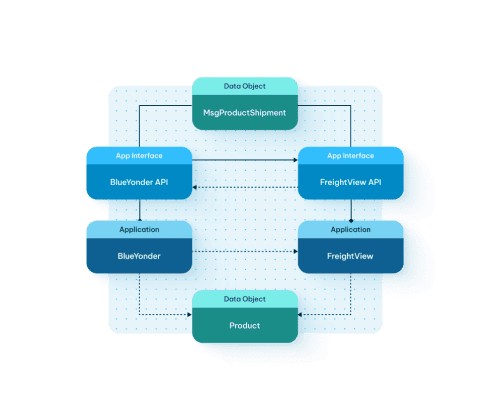
Usage Visibility
Link each entity to the applications
and processes that use or produce it
to create full traceability across your architecture.
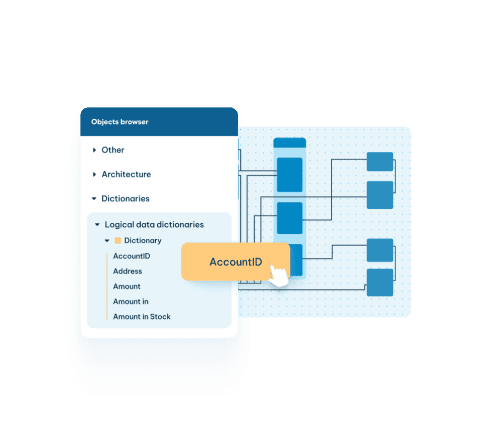
Reusable Objects
Speed up modeling by pulling existing
objects from your repository into your ERDs
and eliminate duplication.
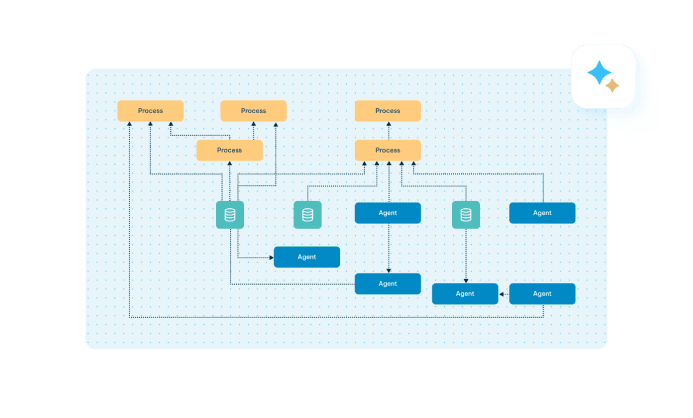
AI-Friendly Data Models
Use your data models as the foundation for AI and
automation initiatives. Supply AI agents with the context
they need for stronger predictions, smarter enrichment,
and more reliable automation.

Technology
Portfolio Management
Understand and govern your full technology stack in one connected view. See the technologies your applications rely on so you can improve stability, reduce risk,
and support modernization.
Technology Inventory
and Classification
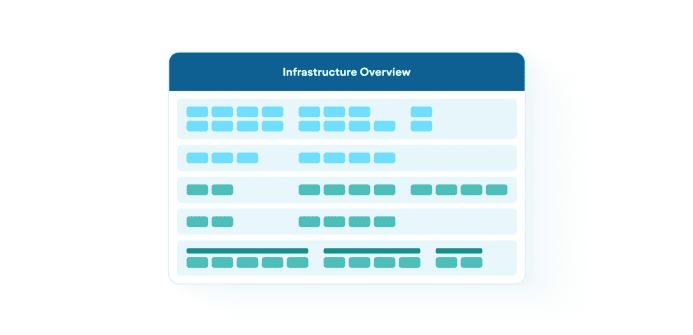
Capture all technology assets in one structured
portfolio and classify them by type, owner,
lifecycle, cost, and strategic value.
Dependency Mapping
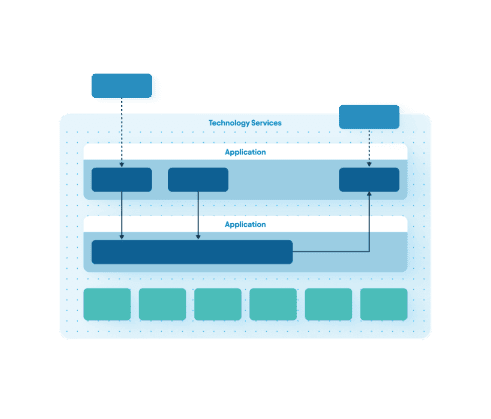
Link technologies to the applications,
integrations, and data stores they
support to reveal dependencies and
assess change impact.
Risk Management
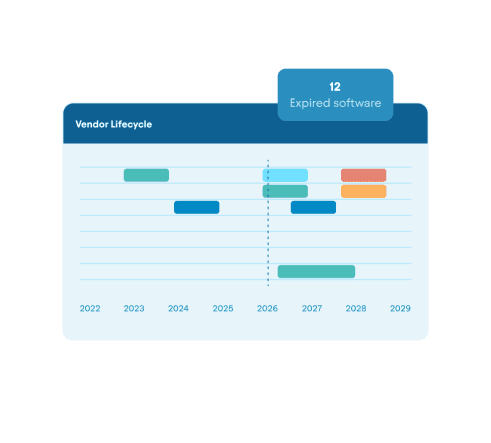
Track versions, support timelines, and end-of-life dates to identify outdated or high-risk technologies and prioritize modernization.
Conditional Layouts
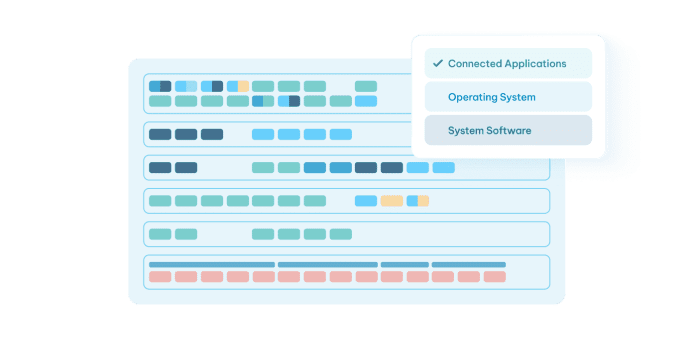
Use conditional formatting to highlight lifecycle
status, risk, cost, ownership gaps, or custom
attributes and spot issues instantly.
Cloud Transformation and
Strategic Planning Support
Guide modernization, cloud migration, and platform decisions
with a connected tech portfolio that pushes updates to your
application and data landscapes automatically.



THE RIGHT TRANSFORMATION SOLUTIONS
START HERE
Considering A switch from an Enterprise Architecture tool?
Get more than doodles. Design change with real context and real impact.